
Mathematics, 29.05.2020 08:58 YokoUndera
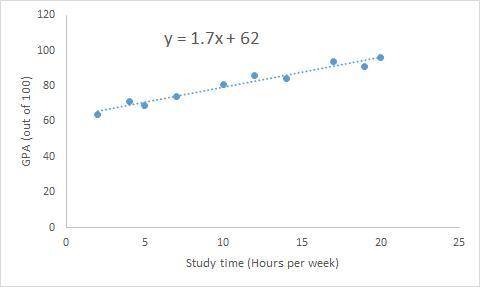
1. We are now going to revisit our data from the homework yesterday, but with our calculator. A survey was
done at Ketcham High School to determine the effect of time spent on studying and grade point average.
The table below shows the results for 10 students randomly selected.
2
4
5
7
10
12
14
17
19
20
Study time
(Hours per week)
GPA
(out of 100)
64
71
69
74
81
86
84
94
91
96
(a) Enter the data in your calculator and use it to generate the equation for the line of best fit. Round your
slope to the nearest tenth and round your y-intercept to the nearest integer.

Answers: 2


Other questions on the subject: Mathematics
Mathematics, 21.06.2019 19:00, Islandgirl67
What are the solutions of the system? solve by graphing. y = x^2 + 3x + 2 y = 2x + 2
Answers: 1
You know the right answer?
1. We are now going to revisit our data from the homework yesterday, but with our calculator. A surv...
Questions in other subjects:
Mathematics, 10.04.2020 00:16


History, 10.04.2020 00:16
Mathematics, 10.04.2020 00:16
History, 10.04.2020 00:16

Mathematics, 10.04.2020 00:16


