
Mathematics, 28.05.2020 20:05 lilpeepxliltracy
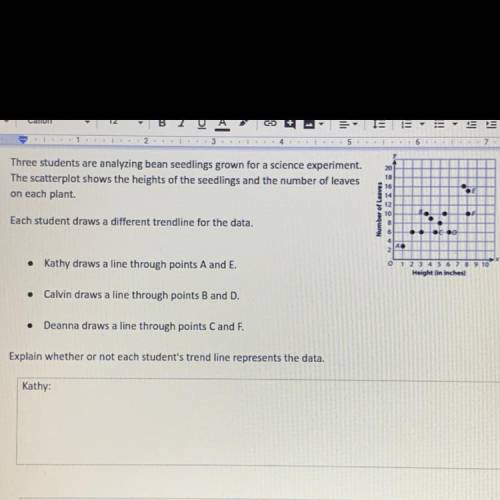
Three students are analyzing bean seedlings grown for a science experiment The scatterplot shows the heights of the seedlings and the number of leaves on each plant.
Each student draws a different tread line for the data.
-Kathy draws a line through points A and E.
-Calvin draws a line through points B and D.
-Deanna draws a line through points C and F.
Explain whether or not each student’s trend line represents the data.

Answers: 3


Other questions on the subject: Mathematics
Mathematics, 21.06.2019 20:30, aavil5659
Clarence wants to buy a new car. he finds an ad for a car that costs 27,200 dollars. suppose his local sales tax is 7%. -how much would he have to pay? -what is the cost of the car including tax? -if clarence has 29,864 saved, can he pay cash to buy the car?
Answers: 1
Mathematics, 21.06.2019 23:00, sandyrose3012
Multiplying fractions by whole number 5 x 1/3=?
Answers: 2
Mathematics, 21.06.2019 23:00, spaigenicole
Someone answer this asap for the first five terms of a sequence are shown. 5, 11, 23, 47, 95, . . which recursive function defines the nth term in the sequence for n > 1? a. f(n) = f(n - 1) + 6 b) f(n) = f(n - 1) + 48 c) f(n) = 3 • f(n - 1) + 1 d) f(n) = 3 • f(n - 1) - 4
Answers: 1
You know the right answer?
Three students are analyzing bean seedlings grown for a science experiment The scatterplot shows the...
Questions in other subjects:

English, 27.07.2019 09:00


Biology, 27.07.2019 09:00
History, 27.07.2019 09:00


