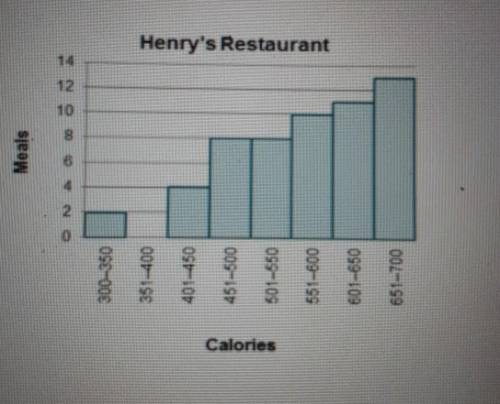
Given the histogram, use the drop-down menus to
identify the elements.
Zero frequenc...

Mathematics, 29.05.2020 02:01 nadine6085859r
Given the histogram, use the drop-down menus to
identify the elements.
Zero frequency
300-350
351-400
401-450
A peak
651-700
601-650
451-500

Answers: 3


Other questions on the subject: Mathematics
Mathematics, 21.06.2019 12:30, biaxialpower789
Idont get this question can someone me solve it? ** the distance light travels in one second (1 light second) is about 1.86 ×10^5 mi. saturn is about 475 light-seconds from the sun. about how many miles from the sun is saturn..my guess is 8.83* 10^7 you so much
Answers: 1
Mathematics, 21.06.2019 16:30, danielmurillo28
If c(x) = 4x – 2 and d(x) = x2 + 5x, what is (cxd)(x)
Answers: 2
Mathematics, 21.06.2019 16:30, msheehan4737
What is the first step of an indirect proof of a number that is divisible by two
Answers: 2
Mathematics, 21.06.2019 19:00, kalebbenton15
What will the graph look like for a system of equations that has no solution? a. the lines will be perpendicular. b. the lines will cross at one point. c. both equations will form the same line. d. the lines will be parallel.
Answers: 1
You know the right answer?
Questions in other subjects:


History, 29.08.2020 06:01

Arts, 29.08.2020 06:01
Arts, 29.08.2020 06:01


