
Mathematics, 28.05.2020 21:06 zhellyyyyy
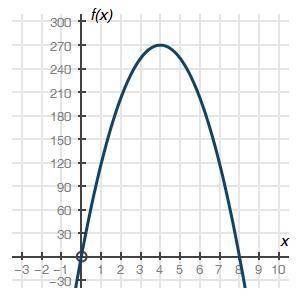
The graph below shows a company's profit f(x), in dollars, depending on the price of erasers x, in dollars, sold by the company:
(Graph is attatched
Part A: What do the x-intercepts and maximum value of the graph represent? What are the intervals where the function is increasing and decreasing, and what do they represent about the sale and profit? (4 points)
Part B: What is an approximate average rate of change of the graph from x = 1 to x = 4, and what does this rate represent? (3 points)
Part C: Describe the constraints of the domain. (3 points)
(Brainliest for those who answer correctly & thorughly!)

Answers: 1


Other questions on the subject: Mathematics
Mathematics, 21.06.2019 14:00, jprado01
Colin listed his assets and liabilities on a personal balance sheet. colin’s balance sheet (august 2013) assets liabilities cash $1,500 credit card $500 stocks $800 rent $800 car $5,000 car loan $1,200 coin collection $1,200 student loan $5,000 total total which statement is true about the total assets and the total liabilities? the total of the assets and the liabilities are the same. the total of the assets is greater than the total of the liabilities. the total of the assets is less than the total of the liabilities. the total of the assets cannot be compared to the total of the liabilities.
Answers: 2
Mathematics, 21.06.2019 16:30, Lpryor8465
Ahome improvement store rents it’s delivery truck for $19 for the first 75 minutes and $4.75 for each additional 1/4 hour. if a customer rented the truck at 11: 10 am and returned the truck at 1: 40 pm the same day, what would his rental cost be?
Answers: 1
You know the right answer?
The graph below shows a company's profit f(x), in dollars, depending on the price of erasers x, in d...
Questions in other subjects:

English, 29.11.2020 21:20

History, 29.11.2020 21:20

Biology, 29.11.2020 21:20
Mathematics, 29.11.2020 21:20
Mathematics, 29.11.2020 21:20
Mathematics, 29.11.2020 21:20
Mathematics, 29.11.2020 21:20


