
Mathematics, 28.05.2020 19:01 noglapotato
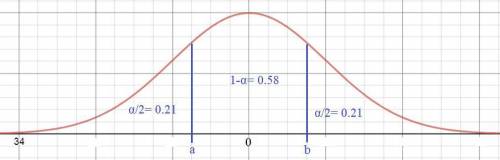
An example of an early application of statistics was in the year 1817. A study of chest circumference among a group of Scottish men exhibited an approximately normal distribution. Their chest circumferences ranged from 33 to 48 inches, with a mean chest measurement of 40 inches and a standard deviation of 2 inches. Make a normal bell curve, then use the Empirical Rule to help you understand the distribution of chest circumferences in the study.
a) What range of chest measurements contains the 58% which fall closest to the mean?
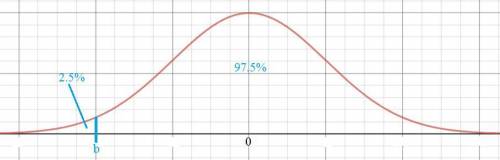
b) What would you expect the chest measurements to be fore the 2.5% of the men with the smallest chest measurements?
c) What would you expect to be the smallest and largest chest measurements of the "middle" 95% of the men?
d) What would you expect to be the measurements of the 16% of the men with the largest chests in the population

Answers: 1


Other questions on the subject: Mathematics
Mathematics, 21.06.2019 21:10, zahradawkins2007
Identify the initial amount a and the growth factor b in the exponential function. a(x)=680*4.3^x
Answers: 2
Mathematics, 21.06.2019 21:30, brandon436
Nine people are going to share a 128-ounces bottle of soda. how many ounces will each person get drink? choose the correct equation and answer for this situation
Answers: 1
Mathematics, 22.06.2019 00:20, mjarrelljr
Astudent showed the steps below while solving the inequality |x-4|< 1 by graphing.
Answers: 3
You know the right answer?
An example of an early application of statistics was in the year 1817. A study of chest circumferenc...
Questions in other subjects:
Mathematics, 24.09.2019 17:30
Mathematics, 24.09.2019 17:30


Physics, 24.09.2019 17:30


