
Mathematics, 27.05.2020 19:10 Mw3spartan17
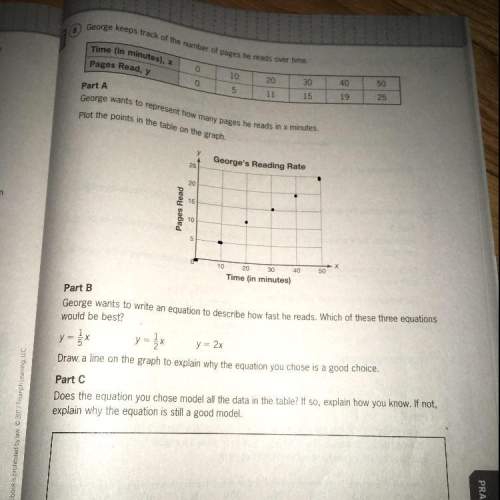
Find the equation of the regression line for the given data. Then construct a scatter plot of the data and draw the regression line. The table shows the shoe size and heights (in.) for 6 men.
font size decreased by 1 font size increased by 1 Shoe size comma x
7.5
9.0
9.5
12.0
12.5
13.5
Height, y
66.5
69.5
73.5
72.5
74.5
74.5
Find the regression equation.

Answers: 2


Other questions on the subject: Mathematics
Mathematics, 21.06.2019 18:30, leobaut6145
Apsychology student wishes to investigate differences in political opinions between business majors and political science majors at her college. she randomly selects 100 students from the 260 business majors and 100 students from the 180 political science majors. does this sampling plan result in a simple random sample? why or why not? no, because each group of 200 students in the sample does not have the same chance of being selected. yes, because each group of 200 students in the sample has the same chance of being selected. no, because each individual student does not have an equal chance of being selected. yes, because each individual student has the same chance of being selected.
Answers: 1
Mathematics, 21.06.2019 18:50, beeboppity
7. the area of the playing surface at the olympic stadium in beijing isof a hectare. what area will it occupy on a plan drawn to a scaleof 1: 500?
Answers: 3
Mathematics, 21.06.2019 21:00, candicecorvette
Check all that apply. f is a function. f is a one-to-one function. c is a function. c is a one-to-one function.
Answers: 3
You know the right answer?
Find the equation of the regression line for the given data. Then construct a scatter plot of the da...
Questions in other subjects:


History, 23.03.2021 19:50
Mathematics, 23.03.2021 19:50

Mathematics, 23.03.2021 19:50


