The frequency table shows the number of points scored during 30 Bulldogs
basketball games. On...

Mathematics, 27.05.2020 10:57 cgkiepe5759
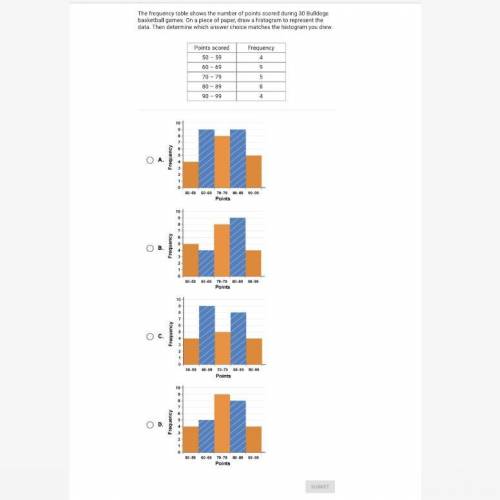
The frequency table shows the number of points scored during 30 Bulldogs
basketball games. On a piece of paper, draw a histogram to represent the data. Then determine which answer choice matches the histogram you drew.

Answers: 2


Other questions on the subject: Mathematics
Mathematics, 21.06.2019 12:30, staffordkimberly
According to the normal model, what percent of receivers would you expect to gain fewer yards than 2 standard deviations below the mean number of yards
Answers: 1
Mathematics, 21.06.2019 20:30, faizanaj1192
Raymond just got done jumping at super bounce trampoline center. the total cost of his session was $43.25 . he had to pay a $7 entrance fee and $1.25 for every minute he was on the trampoline. write an equation to determine the number of minutes (t) that raymond was on the trampoline.
Answers: 1
Mathematics, 21.06.2019 22:30, kaylaamberd
Maria found the least common multiple of 6 and 15. her work is shown below. multiples of 6: 6, 12, 18, 24, 30, 36, 42, 48, 54, 60, . . multiples of 15: 15, 30, 45, 60, . . the least common multiple is 60. what is maria's error?
Answers: 1
You know the right answer?
Questions in other subjects:


History, 16.04.2020 05:01
Mathematics, 16.04.2020 05:01
Mathematics, 16.04.2020 05:01
Mathematics, 16.04.2020 05:01

Biology, 16.04.2020 05:01
Mathematics, 16.04.2020 05:01


