Based on the family the graph below belongs to, which equation could represent the graph?
On a...

Mathematics, 27.05.2020 02:01 jojokeys
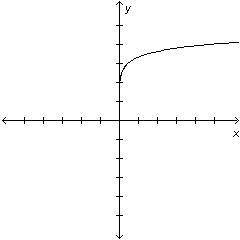
Based on the family the graph below belongs to, which equation could represent the graph?
On a coordinate plane, a curve starts at (0, 2) and curves up and to the right in quadrant 1.
y=2^x+3
y=log(2x)+3
y=2x^2+2
y=1/2x+2

Answers: 1


Other questions on the subject: Mathematics
Mathematics, 21.06.2019 21:30, fheight01
Name and describe the three most important measures of central tendency. choose the correct answer below. a. the mean, sample size, and mode are the most important measures of central tendency. the mean of a data set is the sum of the observations divided by the middle value in its ordered list. the sample size of a data set is the number of observations. the mode of a data set is its highest value in its ordered list. b. the sample size, median, and mode are the most important measures of central tendency. the sample size of a data set is the difference between the highest value and lowest value in its ordered list. the median of a data set is its most frequently occurring value. the mode of a data set is sum of the observations divided by the number of observations. c. the mean, median, and mode are the most important measures of central tendency. the mean of a data set is the product of the observations divided by the number of observations. the median of a data set is the lowest value in its ordered list. the mode of a data set is its least frequently occurring value. d. the mean, median, and mode are the most important measures of central tendency. the mean of a data set is its arithmetic average. the median of a data set is the middle value in its ordered list. the mode of a data set is its most frequently occurring value.
Answers: 3
Mathematics, 21.06.2019 22:30, cramirezorozco392
Whit h equation best represents this situation the number 98 increased by an unknown number equal to 120
Answers: 1
Mathematics, 21.06.2019 23:40, hardwick744
Typically a point in a three dimensional cartesian coordinate system is represented by which of the following answers in the picture !
Answers: 1
You know the right answer?
Questions in other subjects:

Mathematics, 25.05.2020 00:00

Mathematics, 25.05.2020 00:00

History, 25.05.2020 00:00


