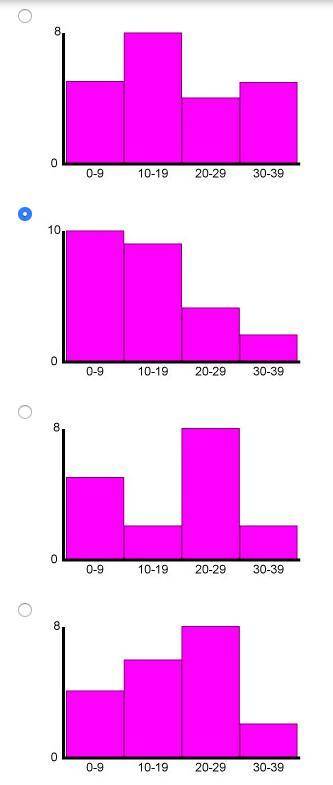
Which of the following histograms represents this set of data?
2, 3, 1, 10, 14, 22, 19,...

Mathematics, 25.05.2020 09:57 buglerboy979
Which of the following histograms represents this set of data?
2, 3, 1, 10, 14, 22, 19, 28, 6, 11, 34, 30, 6, 18, 19, 20, 14, 29, 5, 9, 7, 9, 12, 3, 10
(Ignore the already marked one)

Answers: 2


Other questions on the subject: Mathematics
You know the right answer?
Questions in other subjects:


Mathematics, 29.07.2019 16:20


Advanced Placement (AP), 29.07.2019 16:20


