
Mathematics, 25.05.2020 18:58 719729
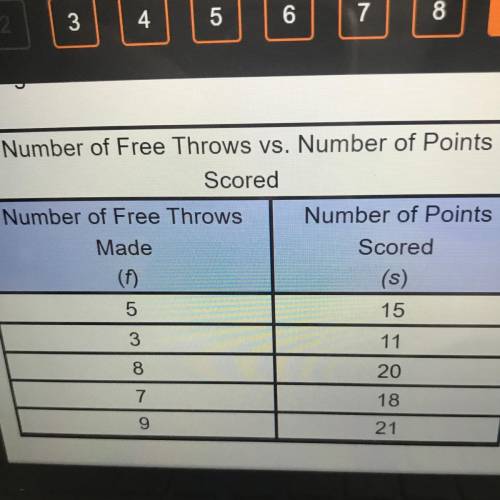
Alex used a regression calculator to find the equation of the trend line y -ax+b for the data in the table. He rounded the values for a and b on his calculator as shown below.
a - 1.7
b-6.2
Which trend line compares the data in the table?
s-1.78+82
s-6.2f+1.7
f-1.75+6.2
f-6.25 +1.7

Answers: 3


Other questions on the subject: Mathematics
Mathematics, 21.06.2019 15:20, kuehlthau03
Which is the equation of an ellipse with directrices at x = ±4 and foci at (2, 0) and (−2, 0)?
Answers: 3
Mathematics, 22.06.2019 00:30, haileybug0305
Brent paid for 6 avocados with a $20.00 bill. he received $10.40 in change. construct and solve an equation can be used to find the price , of each avocados
Answers: 1
You know the right answer?
Alex used a regression calculator to find the equation of the trend line y -ax+b for the data in the...
Questions in other subjects:


Social Studies, 10.09.2021 04:50

History, 10.09.2021 04:50

Mathematics, 10.09.2021 04:50
Chemistry, 10.09.2021 04:50


