
Mathematics, 24.05.2020 23:58 melanie1055
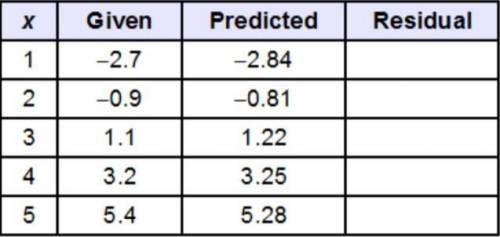
Find the residual values, and use the graphing calculator tool to make a residual plot. (Table attached below)
Does the residual plot show that the line of best fit is appropriate for the data?
A) No, the points are in a curved pattern.
B) No, the points are evenly distributed about the x-axis.
C) Yes, the points are in a linear pattern.
D) Yes, the points have no pattern.

Answers: 3


Other questions on the subject: Mathematics
You know the right answer?
Find the residual values, and use the graphing calculator tool to make a residual plot. (Table attac...
Questions in other subjects:
Mathematics, 07.05.2021 21:50
Mathematics, 07.05.2021 21:50

History, 07.05.2021 21:50

English, 07.05.2021 21:50

Social Studies, 07.05.2021 21:50

Mathematics, 07.05.2021 21:50


