Select the correct graph.
When David first got a job, his annual income was $20,000. He worked...

Mathematics, 24.05.2020 10:57 Gabriella0000
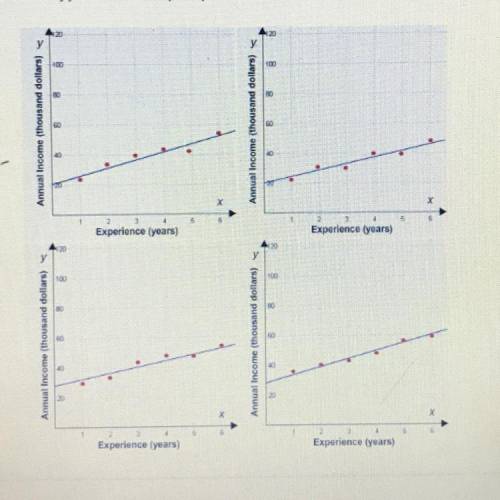
Select the correct graph.
When David first got a job, his annual income was $20,000. He worked hard and got more experience. After 8 years, he realized that his average
increase in pay was about $4,000 every year. Which scatter plot represents this situation?
I need help which graph is it?

Answers: 1


Other questions on the subject: Mathematics
Mathematics, 21.06.2019 13:00, sierram298
∆abc is reflected across the x-axis and translated 2 units up to give the image ∆a'b'c' with coordinates a'(1, 1), b'(2, -1), c'(2, 1). what are the coordinates of the preimage ∆abc? a. a(-1, 1), b(-2, 3), c(-2, 1) b. a(1, 1), b(2, 3), c(2, 1) c. a(1, -3), b(2, -1), c(2, -3) d. a(1, -3), b(2, -5), c(2, -3)
Answers: 2
Mathematics, 21.06.2019 16:30, robclark128
You are updating your garage and the only thing left to paint is your garage day. you're only going to paint the slide that faces the street. the garage door is 9 fert 8inches tall and 120 inches wide. you need to know the surface area of the side of the garage door to determine how much paint to buy. the hardware store sells paint by how much covers a square foot. what is the surface area you should report to the hardware store what is the answer
Answers: 3
Mathematics, 21.06.2019 17:00, cordovatierra16
Which graph corresponds to the function f(x) = x2 + 4x – 1?
Answers: 1
You know the right answer?
Questions in other subjects:

Physics, 26.03.2021 16:40


History, 26.03.2021 16:40
Mathematics, 26.03.2021 16:40


