
Mathematics, 24.05.2020 05:58 liana8
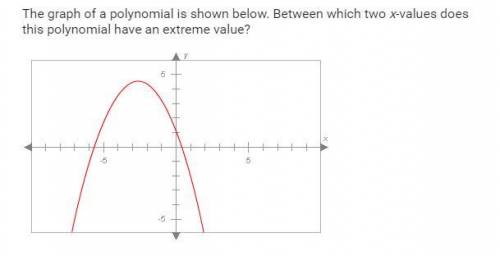
The graph of a polynomial is shown below. Between which two x-values does this polynomial have an extreme value?
A.-2 to -1
B.-6 to -5
C.-3 to -2
D.-1 to 1

Answers: 3


Other questions on the subject: Mathematics
Mathematics, 21.06.2019 14:40, kiasiab17
The physical fitness of an athlete is often measured by how much oxygen the athlete takes in (which is recorded in milliliters per kilogram, ml/kg). the mean maximum oxygen uptake for elite athletes has been found to be 60 with a standard deviation of 7.2. assume that the distribution is approximately normal.
Answers: 3
Mathematics, 22.06.2019 00:00, bracefacer42
The data set represents the ages of players in a chess club. 27, 34, 38, 16, 22, 45, 54, 60. what is the mean absolute deviation of the data set?
Answers: 3
You know the right answer?
The graph of a polynomial is shown below. Between which two x-values does this polynomial have an ex...
Questions in other subjects:

Mathematics, 13.04.2021 23:00

History, 13.04.2021 23:00

Chemistry, 13.04.2021 23:00

Mathematics, 13.04.2021 23:00


