
Mathematics, 24.05.2020 02:02 soogy
A manager is assessing the correlation between the number of employees in a plant and the number of products produced yearly. The table shows the data:
Number of employees
(x) 0 25 50 75 100 125 150 175 200
Number of products
(y) 10 160 310 460 610 760 910 1060 1210
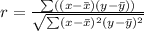
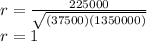
Part A: Is there any correlation between the number of employees in the plant and the number of products produced yearly? Justify your answer. (4 points)
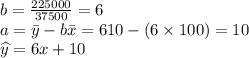
Part B: Write a function that best fits the data. (3 points)
Part C: What does the slope and y-intercept of the plot indicate? (3 points)

Answers: 1


Other questions on the subject: Mathematics
Mathematics, 21.06.2019 15:30, allisonpinegar7830
What is this inequality notation? t is less then or equal to 2
Answers: 3
Mathematics, 21.06.2019 19:30, Robloxdemonduckyt
Піf x = y and y= z, which statement must be true? оа. -x = -2 b. x= z ос. —x = 2 od. 2= x
Answers: 3
Mathematics, 21.06.2019 20:00, whosdarrin9396
If cos(2x) = tan^2(y), show that cos(2y) = tan^2(x).
Answers: 3
Mathematics, 21.06.2019 20:00, annieleblanc2004
Which type of graph would allow us to quickly see how many students between 100 and 200 students were treated?
Answers: 1
You know the right answer?
A manager is assessing the correlation between the number of employees in a plant and the number of...
Questions in other subjects:


Mathematics, 15.07.2020 02:01


