
Mathematics, 24.05.2020 01:58 aiueo6692
A manager is assessing the correlation between the number of employees in a plant and the number of products produced yearly. The table shows the data:
Number of employees
(x) 0 25 50 75 100 125 150 175 200
Number of products
(y) 10 160 310 460 610 760 910 1060 1210
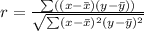
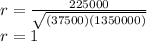
Part A: Is there any correlation between the number of employees in the plant and the number of products produced yearly? Justify your answer. (4 points)
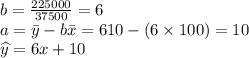
Part B: Write a function that best fits the data. (3 points)
Part C: What does the slope and y-intercept of the plot indicate? (3 points)

Answers: 3


Other questions on the subject: Mathematics
Mathematics, 21.06.2019 18:10, sajdshjad751
Abc will undergo two transformations to give aa'b'c' which pair of transformations will give a different image of aabc if the order of the transformations is reversed? a. a rotation 90' counterclockwise about the origin followed by a reflection across the y-axis b a translation 5 units down followed by a translation 4 units to the right c. a reflection across the x-axis followed by a reflection across the y-axis a rotation 180'clockwise about the ongin followed by a reflection across the y-axis reset next 2 omentum all rights reserved o atk me anything o o e
Answers: 1
Mathematics, 21.06.2019 18:30, Lakenwilliams1250
Select 2 statements that are true about the equation y+6=-10(x-3).1) the slope of the line is -102) the slope of the line is 33) one point on the line is (3,6)4) one point on the line is (3,-6)
Answers: 1
Mathematics, 21.06.2019 18:30, FailingstudentXD
Do some research and find a city that has experienced population growth. determine its population on january 1st of a certain year. write an exponential function to represent the city’s population, y, based on the number of years that pass, x after a period of exponential growth. describe the variables and numbers that you used in your equation.
Answers: 3
You know the right answer?
A manager is assessing the correlation between the number of employees in a plant and the number of...
Questions in other subjects:


Mathematics, 06.06.2020 17:58


