A survey of 525 people was conducted to determine whether they have brothers and sisters.
• Th...

Mathematics, 24.05.2020 02:00 schnefai000
A survey of 525 people was conducted to determine whether they have brothers and sisters.
• The results showed that 24% of the people surveyed do not have a sister and 68% of the people surveyed have a
brother
The results also show that 93 of the people surveyed do not have sister and do not have a brother.
Complete the two-way frequency table to show the results of the survey.
Have a Brother
Do Not Have a Brother
Total
Have
Sister
Do
Not
Have
а
Sister
Total
525

Answers: 1


Other questions on the subject: Mathematics
Mathematics, 21.06.2019 22:40, bullockarwen
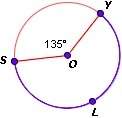
Which of the following circles have their centers on the x-axis? check all that apply.
Answers: 1
Mathematics, 22.06.2019 02:30, TeenOlaflover
Why can't my rank go i have 1723 points, but my rank is only at ambitious, which is only 250 points! like, (p. s. i know this isn't related to math, but i just don't know why it's doing this and i would really appreciate if someone could tell me whats going on with this)
Answers: 1
Mathematics, 22.06.2019 03:00, dominiqueallen23
Describe how the presence of possible outliers might be identified on the following. (a) histograms gap between the first bar and the rest of bars or between the last bar and the rest of bars large group of bars to the left or right of a gap higher center bar than surrounding bars gap around the center of the histogram higher far left or right bar than surrounding bars (b) dotplots large gap around the center of the data large gap between data on the far left side or the far right side and the rest of the data large groups of data to the left or right of a gap large group of data in the center of the dotplot large group of data on the left or right of the dotplot (c) stem-and-leaf displays several empty stems in the center of the stem-and-leaf display large group of data in stems on one of the far sides of the stem-and-leaf display large group of data near a gap several empty stems after stem including the lowest values or before stem including the highest values large group of data in the center stems (d) box-and-whisker plots data within the fences placed at q1 â’ 1.5(iqr) and at q3 + 1.5(iqr) data beyond the fences placed at q1 â’ 2(iqr) and at q3 + 2(iqr) data within the fences placed at q1 â’ 2(iqr) and at q3 + 2(iqr) data beyond the fences placed at q1 â’ 1.5(iqr) and at q3 + 1.5(iqr) data beyond the fences placed at q1 â’ 1(iqr) and at q3 + 1(iqr)
Answers: 1
You know the right answer?
Questions in other subjects:

Biology, 23.12.2019 22:31

Biology, 23.12.2019 22:31


Health, 23.12.2019 22:31
Biology, 23.12.2019 22:31


