
Mathematics, 23.05.2020 02:03 Gabbymadrid3240
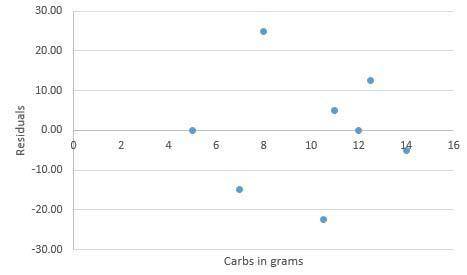
The predicted calories in food items based on grams of carbs are represented by the residual plot.
Residual plot with x-axis labeled carbs in grams and y-axis labeled residuals. There are eight points plotted 5 and 0, 7 and negative 15, 8 and 25, 10.5 and negative 22.5, 11 and 5, 12 and 0, 12.5 and 12.5, and 14 and negative 5.
What does the pattern in the residual plot indicate about the type of model? (4 points)
Group of answer choices
The pattern is random, indicating a good fit for a nonlinear model.
The pattern is random, indicating a good fit for a linear model.
The pattern shows the points are far from the zero line, indicating a good fit for a linear model.
The pattern shows the points are far from the zero line, indicating a good fit for a nonlinear model.

Answers: 2


Other questions on the subject: Mathematics
Mathematics, 20.06.2019 18:02, maritzamartinnez
If a boat travels 3 miles in 1.5 hours how far will it travel in 1 hour
Answers: 2
Mathematics, 21.06.2019 16:00, clarkster112679
1- identificar select the category that corresponds to each term. january 23 11: 59 pm unlimited attempts remaining grade settings 276-279 vocabulary list modelo fiesta quinceañera casada adolescencia viudo juventud navidad niñez vejez aniversario de bodas divorciado madurez cumpleaños soltera
Answers: 2
Mathematics, 21.06.2019 16:20, amortegaa805
Which best explains why this triangle is or is not a right triangle?
Answers: 1
Mathematics, 21.06.2019 21:30, Joejoe1813
Due to bad planning, two of the local schools have their annual plays on the same weekend. while 457 people attend one, and 372 attend the other, only 104 people were able to attend both. how many people went to at least one play?
Answers: 1
You know the right answer?
The predicted calories in food items based on grams of carbs are represented by the residual plot.
Questions in other subjects:


Arts, 07.10.2019 18:00


Biology, 07.10.2019 18:00


