
Mathematics, 23.05.2020 23:59 avree6692
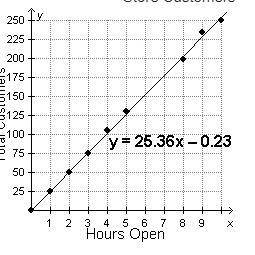
A store owner recorded the total number of customers that visited his store at the end of each hour that the store was open. He created the scatterplot, trend line, and equation below based on the data.
Store Customers
A graph has hours open on the x-axis, and total customers on the y-axis. A trend line has a regression equation of y = 25.36 x minus 0.23.
Assuming that the trend continues, which is the best estimate for the number of hours that the store will have been open when the total customer count is 310?

Answers: 3


Other questions on the subject: Mathematics
Mathematics, 21.06.2019 14:00, cami30031cami3003
Which pair of lines is parallel? a. y=4x+1 and y+4=5 b. y=-2+x and 2y-2x=-2 c. y=1/4x + 2 and y-2=1/2x d. y=1/5x+1 and 5y+x= 10
Answers: 2
You know the right answer?
A store owner recorded the total number of customers that visited his store at the end of each hour...
Questions in other subjects:

Social Studies, 13.02.2020 02:22

Mathematics, 13.02.2020 02:22
Mathematics, 13.02.2020 02:22


Mathematics, 13.02.2020 02:22

History, 13.02.2020 02:22
Mathematics, 13.02.2020 02:22


