
Mathematics, 23.05.2020 00:06 sweetbee633
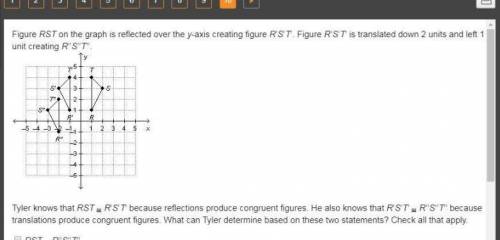
Figure RST on the graph is reflected over the y-axis creating figure R’S’T’. Figure R’S’T’ is translated down 2 units and left 1 unit creating R’’S’’T’’.
(images below)

Answers: 3


Other questions on the subject: Mathematics
Mathematics, 21.06.2019 13:40, emilyswinge4421
Which expression is equivalent to (4x^3*y^5)(3x^5*y)^2 \a) 24x^13*y^7b) 36x^13*y^7c) 36x^28*y^7d) 144x^16*y^12
Answers: 1
Mathematics, 21.06.2019 20:00, desereemariahha
Someone answer asap for ! the following statements are true about the coins calvin and sasha have collected. * calvin and sasha has the same amount of money. * calvin has only quarters. * sasha has dimes, nickels, and pennies * calvin has the same number of quarters as sasha has dimes. * sasha has $1.95 in coins that are not dimes. exactly how many quarters does calvin have?
Answers: 3
Mathematics, 21.06.2019 22:30, ondreabyes225pcr83r
Adistribution has the five-number summary shown below. what is the third quartile, q3, of this distribution? 22, 34, 41, 55, 62
Answers: 2
Mathematics, 21.06.2019 23:30, claytonhopkins
In a study of the relationship between socio-economic class and unethical behavior, 129 university of california undergraduates at berkeley were asked to identify themselves as having low or high social-class by comparing themselves to others with the most (least) money, most (least) education, and most (least) respected jobs. they were also presented with a jar of individually wrapped candies and informed that the candies were for children in a nearby laboratory, but that they could take some if they wanted. after completing some unrelated tasks, participants reported the number of candies they had taken. it was found that those who were identiď¬ed as upper-class took more candy than others. in this study, identify: (a) the cases, (b) the variables and their types, (c) the main research question, (d) identify the population of interest and the sample in this study, and (e) comment on whether or not the results of the study can be generalized to the population, and if the ď¬ndings of the study can be used to establish causal relationships.
Answers: 2
You know the right answer?
Figure RST on the graph is reflected over the y-axis creating figure R’S’T’. Figure R’S’T’ is transl...
Questions in other subjects:

History, 10.02.2021 21:30
History, 10.02.2021 21:30

Mathematics, 10.02.2021 21:30

Social Studies, 10.02.2021 21:30
Mathematics, 10.02.2021 21:30


