
Mathematics, 23.05.2020 19:57 zacharysharpe2805
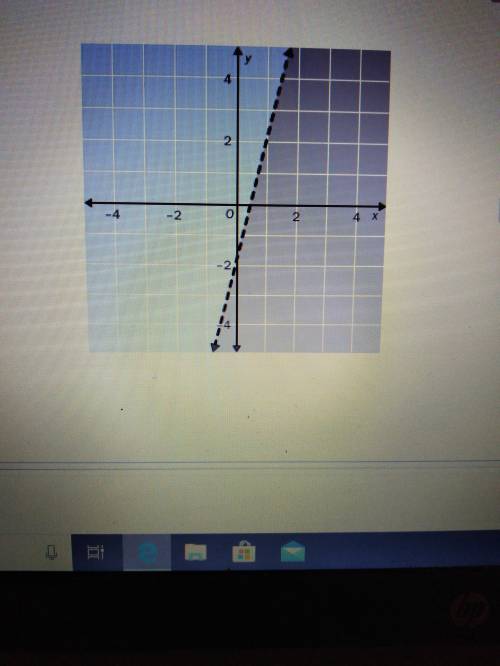
Choose the linear inequality that describes the graph. The gray area represents the shaded region.
A. y ≤ -4x - 2 , B. y > -4x -2 , C. y ≥ -4x - 2 , D. y < 4x -2

Answers: 1


Other questions on the subject: Mathematics
Mathematics, 22.06.2019 01:50, kingdevin16
Felix wrote several equations and determined that only one of the equations has no solution. which of these equations has no solution?
Answers: 3
Mathematics, 22.06.2019 04:00, Nainaigurl1
Ineed ! what is the connection between ratios, fractions, and percents? give an example with your answer.
Answers: 2
Mathematics, 22.06.2019 05:20, tannerlynn4320
(! ) the figure below shows parallelograms abce, pqrs, and tnlm on a coordinate plane. points s, p, q, and r are midpoints of abce t, n, l, and m are midpoints of pqrs write the equation of line ml. show your work.
Answers: 1
You know the right answer?
Choose the linear inequality that describes the graph. The gray area represents the shaded region. <...
Questions in other subjects:


Geography, 20.08.2020 03:01

Chemistry, 20.08.2020 03:01


English, 20.08.2020 03:01


