
Mathematics, 22.05.2020 14:57 sjsmith21
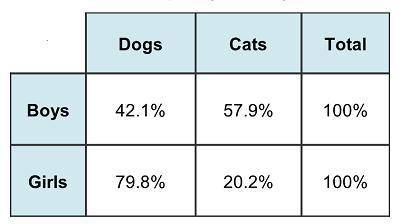
The 1st graders at City Elementary were asked whether they like dogs or cats best. The results are shown in the table. Relative Frequency Table by Row What conclusion can you draw about the relative frequency of the results?
A) A girl in this group is most likely to prefer cats.
B) A boy in this group is most likely to prefer cats.
C) A boy in this group is most likely to prefer dogs.
D) There is no association between the variables.
A girl in this group is most likely to prefer dogs

Answers: 2


Other questions on the subject: Mathematics
Mathematics, 21.06.2019 18:30, gracynamos
Express the following as a function of a single angle. cos(60) cos(-20) - sin(60) sin(-20)
Answers: 1
Mathematics, 21.06.2019 19:30, Cupcake8189
Which inequality has a dashed boundary line when graphed ?
Answers: 2
Mathematics, 22.06.2019 00:00, isabellecannuli
Margaret is purchasing a house for $210,000 with a 15 year fixed rate mortgage at 4.75% interest she has made a 5% down payment the house is valued at 205,000 and the local tax rate is 3.5% homeowners insurance 600 per year what are her total monthly payment
Answers: 1
You know the right answer?
The 1st graders at City Elementary were asked whether they like dogs or cats best. The results are s...
Questions in other subjects:
Mathematics, 21.12.2020 20:50

Business, 21.12.2020 20:50


Chemistry, 21.12.2020 20:50
Mathematics, 21.12.2020 20:50

Mathematics, 21.12.2020 20:50


