PLEASE HELP! IS URGENT. WILL GIVE BRAINLIEST
Use the given graph to determine the limit,...

Mathematics, 23.05.2020 11:59 amazinga
PLEASE HELP! IS URGENT. WILL GIVE BRAINLIEST
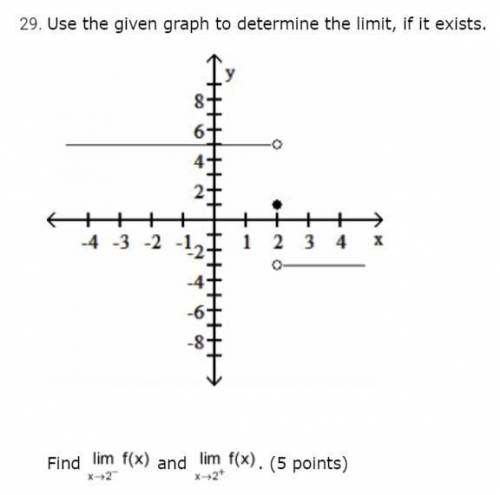
Use the given graph to determine the limit, if it exists.
A coordinate graph is shown with a horizontal line crossing the y axis at five that ends at the open point 2, 5, a closed point at 2, 1, and another horizontal line starting at the open point 2, negative 3 and continues to the right.
Find limit as x approaches two from the left of f of x. and limit as x approaches two from the right of f of x.

Answers: 2


Other questions on the subject: Mathematics
Mathematics, 21.06.2019 20:20, bbyjoker
Recall that the owner of a local health food store recently started a new ad campaign to attract more business and wants to know if average daily sales have increased. historically average daily sales were approximately $2,700. the upper bound of the 95% range of likely sample means for this one-sided test is approximately $2,843.44. if the owner took a random sample of forty-five days and found that daily average sales were now $2,984, what can she conclude at the 95% confidence level?
Answers: 1
Mathematics, 22.06.2019 00:00, thelonewolf5020
4. bob solved the inequality problem below incorrectly. explain his error and redo the problem showing the correct answer. −2x + 5 < 17 −2x + 5-5 < 17-5 -2x/-2 < 12/-2 x < -6
Answers: 2
You know the right answer?
Questions in other subjects:
Mathematics, 14.05.2021 04:20

History, 14.05.2021 04:20

Arts, 14.05.2021 04:20


Mathematics, 14.05.2021 04:20
Mathematics, 14.05.2021 04:20
Mathematics, 14.05.2021 04:20


