
Mathematics, 23.05.2020 07:02 merrickrittany
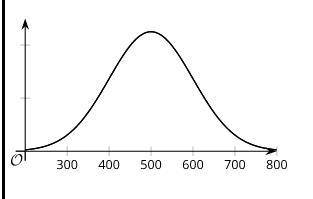
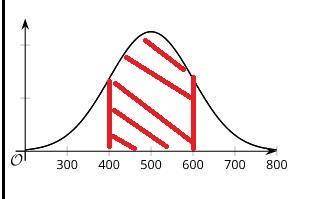
A normal curve with a mean of 500 and a standard deviation of 100 is shown. Shade the region under the curve within one standard deviation of the mean. How much of the data falls within the shaded region?

Answers: 2


Other questions on the subject: Mathematics
Mathematics, 21.06.2019 21:40, jacobasencio23
Use sigma notation to represent the following series for 9 terms.
Answers: 2
Mathematics, 22.06.2019 00:00, emmagbales
Given the diagram below, michael writes, "segment ac is congruent to segment ac." which of the following reasons allow him to write this statement?
Answers: 1
Mathematics, 22.06.2019 00:30, katherineedwards1105
Jan accidently ran 7 minutes longer than he was supposed to. write an expression for the total amount of time jan ran if she was supposed to run m minutes
Answers: 1
You know the right answer?
A normal curve with a mean of 500 and a standard deviation of 100 is shown. Shade the region under t...
Questions in other subjects:

Health, 12.11.2019 07:31
Mathematics, 12.11.2019 07:31

Biology, 12.11.2019 07:31


