
Mathematics, 23.05.2020 00:58 rebeccacruzz2017
Hoping to increase pizza sales on Tuesdays, a new pizza restaurant prints and disperses the following coupon through email and fliers in a neighborhood marketing magazine
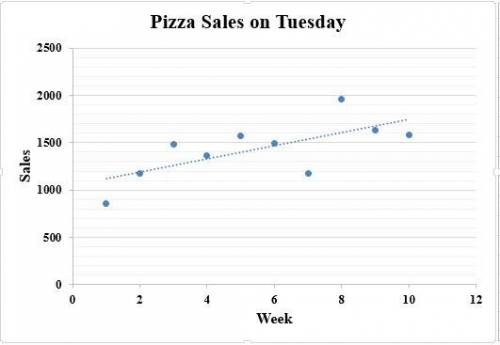
After ten weeks of the coupon offer, the owner of the restaurant needs to decide if the restaurant should continue to run the same special or offer a new one. Use the data collected in the table to determine whether or not the coupon appears to be generating sales for the restaurant.
Week Total
Sales
1 $859
2 $1,176
3 $1,480
4 $1,365
5 $1,576
6 $1,498
7 $1,180
8 $1,964
9 $1,634
10 $1,580
Part A: Create a scatter plot and the line of best fit to represent the data in the table. Be sure to label each axis, as well as to include the proper titles for the scatter plot.
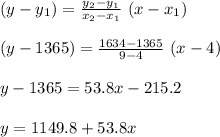
Part B: Use the total sales for weeks 4 and 9 to write an equation for the line of best fit. In your final answer, include all of your calculations.
Part C: in terms of the slope of the equation for the line of best fit, explain whether or not you think the coupon is responsible for the restaurant's increase or decrease in pizza sales on Tuesdays. Use complete sentences in your answer.
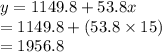
Part D: Assuming that the pizza restaurant wishes to continue the coupon for an additional five weeks, use the equation for the line of best fit to predict the restaurant's sales for the Tuesday of the 15th week.

Answers: 3


Other questions on the subject: Mathematics
Mathematics, 21.06.2019 18:30, rocksquad9125
Ricky takes out a $31,800 student loan to pay his expenses while he is in college. after graduation, he will begin making payments of $190.66 per month for the next 30 years to pay off the loan. how much more will ricky end up paying for the loan than the original value of $31,800? ricky will end up paying $ more than he borrowed to pay off the loan.
Answers: 1
Mathematics, 21.06.2019 21:10, madisontrosclair2
Plot a point at the y-intercept of the following function on the provided graph. 3y=-5x+7 20 points
Answers: 1
You know the right answer?
Hoping to increase pizza sales on Tuesdays, a new pizza restaurant prints and disperses the followin...
Questions in other subjects:

Spanish, 18.04.2021 01:00


Biology, 18.04.2021 01:00


