
Mathematics, 22.05.2020 21:08 therealnana
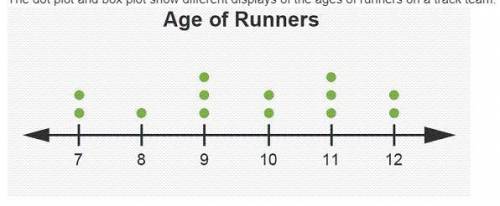
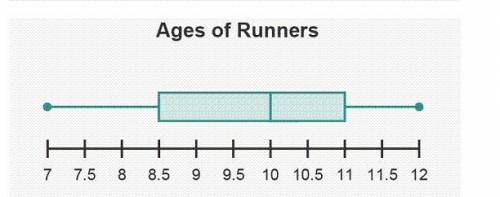
The dot plot and box plot show different displays of the ages of runners on a track team.
Which statements best describe the dot plot or box plot? Check all that apply.
1.) Add the number of dots above each age in the dot plot to find the number of players on the team: 2 + 1 + 3 + 2 + 3 + 2 = 13.
2.) Subtract the maximum and minimum values of the box plot to find the number of players on the team: 12 – 7.
3.) The median appears clearly on the dot plot at the center of the number line: 9.5. 4.) The median appears clearly on the box plot at the line within the box: 10.
5.) The dot plot is the only display that can be used to show the variability of the data. 6.) The box plot is the only display that can be used to show the variability of the data.
Please answer quickly.

Answers: 1


Other questions on the subject: Mathematics
Mathematics, 21.06.2019 19:20, solobiancaa
Which of the following quartic functions has x = –1 and x = –2 as its only two real zeroes?
Answers: 1
Mathematics, 21.06.2019 23:00, rosier2230
Someone answer this asap for the length, in feet, of a rectangular rug is represented by the expression 5x² + 2x. the width, in feet, is represented by the expression 3x². which expression represents the perimeter, in feet, of the rug? a. 8x² + 2x b. 8x² + 4x c. 16x² + 2x d. 16x² + 4x
Answers: 2
You know the right answer?
The dot plot and box plot show different displays of the ages of runners on a track team.
Questions in other subjects:

Mathematics, 13.01.2021 02:20
Mathematics, 13.01.2021 02:20


Social Studies, 13.01.2021 02:20
Mathematics, 13.01.2021 02:20


