
Mathematics, 22.05.2020 21:04 dedrenabouyer
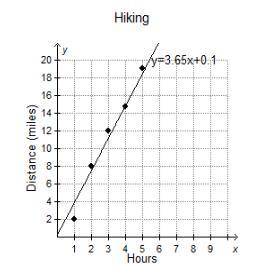
The graph shows the best-fit regression model for a set of data comparing the number of hours spent hiking and the number of miles traveled in one day.
A) Each point in the data set falls on the regression line.
B) The regression model is an accurate representation of the distance for any number of hours hiked.
C) Each point in the data set is near the regression line.
D) The regression model is inaccurate, as it does not begin at (0, 0).

Answers: 1


Other questions on the subject: Mathematics
Mathematics, 21.06.2019 14:30, kajjumiaialome
Isee the amount was $90.00 then reduced to $75.00 , what is the percent ?
Answers: 1
Mathematics, 21.06.2019 16:20, jaueuxsn
Tomas is making trail mix using granola and walnuts. he can spend a total of $12 on the ingredients. he buys 3 pounds of granola that costs $2.00 per pound. the walnuts cost $6 per pound. he uses the equation to represent the total cost, where x represents the number of pounds of granola and y represents the number of pounds of walnuts. he solves the equation for y, the number of pounds of walnuts he can buy. answer- b tomas added 6 to both sides of the equation instead of subtracting 6. just took the test
Answers: 1
You know the right answer?
The graph shows the best-fit regression model for a set of data comparing the number of hours spent...
Questions in other subjects:


English, 12.03.2021 15:40

Computers and Technology, 12.03.2021 15:40


