
Mathematics, 21.05.2020 08:58 Carri425
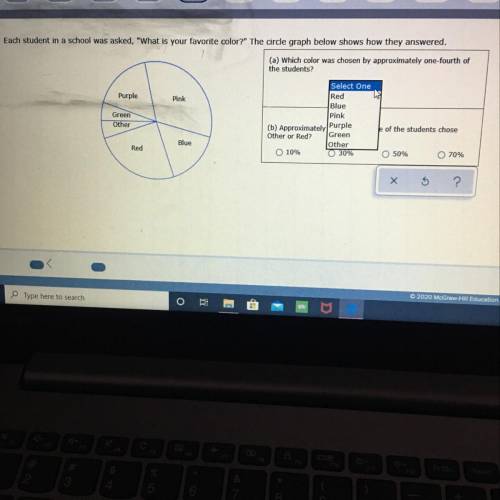
Each student in a school was asked, "What is your favorite color?" The circle graph below shows how they answered.
(a) Which color was chosen by approximately one-fourth of
the students?
(b) Approximately what percentage of the students chose Other or Red?

Answers: 3


Other questions on the subject: Mathematics
Mathematics, 21.06.2019 22:00, kkeith121p6ujlt
5. (03.02)if g(x) = x2 + 3, find g(4). (2 points)1619811
Answers: 1
Mathematics, 21.06.2019 23:00, angeladominguezgarci
If i purchase a product for $79.99 and two accessories for 9.99 and 7.00 how much will i owe after taxes applies 8.75%
Answers: 2
You know the right answer?
Each student in a school was asked, "What is your favorite color?" The circle graph below shows how...
Questions in other subjects:

English, 29.01.2021 17:20
Mathematics, 29.01.2021 17:20
Mathematics, 29.01.2021 17:20
Mathematics, 29.01.2021 17:20


Biology, 29.01.2021 17:20
Mathematics, 29.01.2021 17:20


