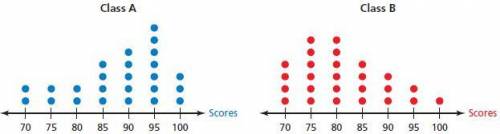
The dot plots show the test scores for two classes taught by the
same teacher.
a....

Mathematics, 21.05.2020 21:03 ramirecinthi24
The dot plots show the test scores for two classes taught by the
same teacher.
a. Compare the populations using measures of center and variation.
b. Express the difference in the measures of center as a multiple of each
measure of variation.

Answers: 2


Other questions on the subject: Mathematics
Mathematics, 21.06.2019 19:30, daquanmcqueen77
Are triangles the congruent? write the congruency statement. what is the congruency that proves they are congruent? what is the perimeter of ∆pqr?
Answers: 1
Mathematics, 21.06.2019 21:00, ambermcneil3839
Aquadrilateral has exactly one pair of parallel sides. which name best describes the figure?
Answers: 3
You know the right answer?
Questions in other subjects:

Mathematics, 19.11.2020 18:40

English, 19.11.2020 18:40
Mathematics, 19.11.2020 18:40

Health, 19.11.2020 18:40

History, 19.11.2020 18:40


