The graph below shows a company's profit f(x), in dollars, depending on the price of
erasers x...

Mathematics, 20.05.2020 15:57 Kadancepiggott7
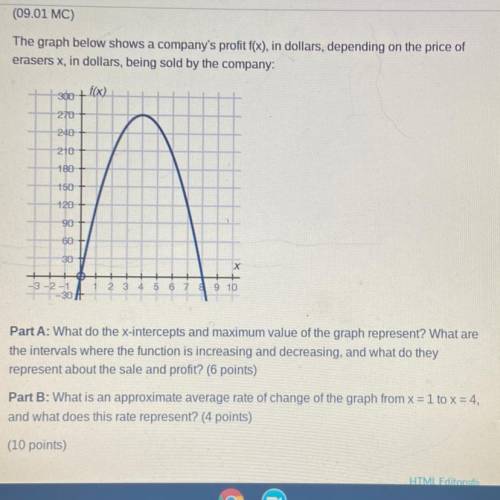
The graph below shows a company's profit f(x), in dollars, depending on the price of
erasers x, in dollars, being sold by the company:
30+ f(x)
270
NO
210
180
150
120
X
910
Part A: What do the x-intercepts and maximum value of the graph represent? What are
the intervals where the function is increasing and decreasing, and what do they
represent about the sale and profit? (6 points)
Part B: What is an approximate average rate of change of the graph from x = 1 to x = 4,
and what does this rate represent? (4 points)
Plz help

Answers: 1


Other questions on the subject: Mathematics
Mathematics, 21.06.2019 16:30, andybiersack154
If 20% of a number is 35, what is 50% of that number?
Answers: 2
Mathematics, 21.06.2019 19:30, BarcaOsama
Which of the following is the explicit rule for a geometric sequence defined a recursive formula of a -5a for which the first term is 23?
Answers: 1
You know the right answer?
Questions in other subjects:

Mathematics, 29.01.2022 14:00

Social Studies, 29.01.2022 14:00

Computers and Technology, 29.01.2022 14:00


Mathematics, 29.01.2022 14:00


