
Mathematics, 20.05.2020 00:57 itzdulce
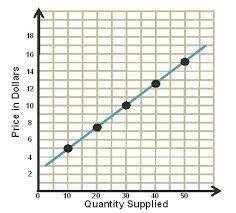
The graph shows the market for graphic t-shirts. What does the graph show about the relationship between a product and its price

Answers: 2


Other questions on the subject: Mathematics
Mathematics, 21.06.2019 18:00, RoyalGurl01
Identify which functions are linear or non-linear. a. f(x) = x2 + 1 b. f(x) = 2x + 5 c. f(x) = x 2 + 3 d. f(x) = 3 x + 7 e. f(x) = 4x + 10 2 - 5
Answers: 1
Mathematics, 21.06.2019 18:00, gyexisromero10
The estimated number of people to attend the last bengals game of the season was 2000. the actual number of fans attending was 1200. by what percent did the estimate differ from the actual?
Answers: 3
Mathematics, 21.06.2019 22:30, brookerebman15
Find solution of the linear equation y = 2/3x + 1/3
Answers: 2
Mathematics, 21.06.2019 23:00, floresguppy
Jane’s favorite fruit punch consists of pear, pineapple, and plum juices in the ratio 5: 2: 3. how many cups of pear juice should she use to make 20 cups of punch?
Answers: 1
You know the right answer?
The graph shows the market for graphic t-shirts. What does the graph show about the relationship bet...
Questions in other subjects:
Mathematics, 27.08.2019 03:20

Biology, 27.08.2019 03:30

Mathematics, 27.08.2019 03:30

History, 27.08.2019 03:30
Mathematics, 27.08.2019 03:30
Mathematics, 27.08.2019 03:30


