PLEASE HELP FAST ( 25 PTS)
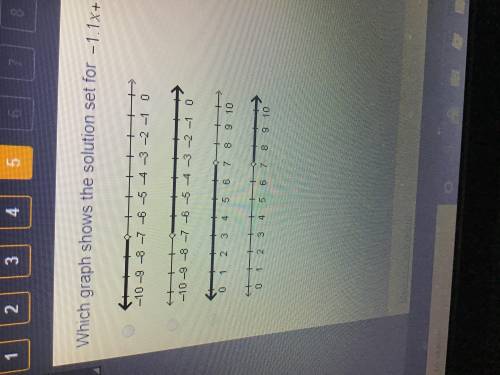
Which graph shows the solution set for
-1.1x + 6.4 > -1.3...

Mathematics, 19.05.2020 21:03 anggar20
PLEASE HELP FAST ( 25 PTS)
Which graph shows the solution set for
-1.1x + 6.4 > -1.3

Answers: 2


Other questions on the subject: Mathematics
Mathematics, 21.06.2019 12:40, imhorribleatmath90
The price of a particular stock is represented by the linear equation , where x represents the number of weeks the stock has been owned and y represents the price of the stock, in dollars. if this relationship continues, what is the price of the stock after it has been owned for 12 weeks? $92.55 $94.37 $100.52 $114.39
Answers: 3
Mathematics, 21.06.2019 16:00, codycollier
Which rational number could be graphed between -4 and -5
Answers: 1
You know the right answer?
Questions in other subjects:
Mathematics, 22.11.2020 09:50

History, 22.11.2020 09:50
History, 22.11.2020 09:50
Mathematics, 22.11.2020 09:50
Mathematics, 22.11.2020 09:50

English, 22.11.2020 09:50
Mathematics, 22.11.2020 09:50


