
Mathematics, 19.05.2020 18:58 onewaydemon
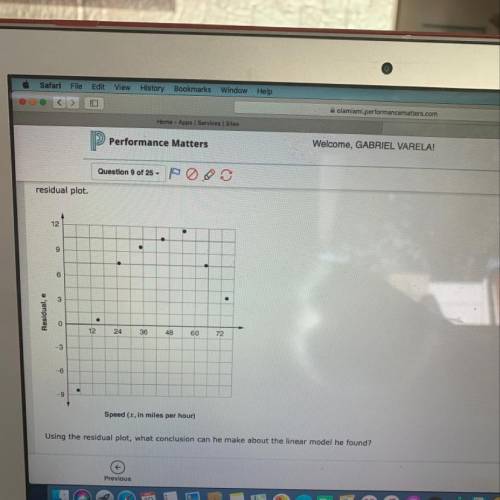
Leonard is studying the relationship between the fuel efficiency in miles per gallon (mp3), y, and the speed in miles per hour (mph), x, of his car. He collected data for
8 different speeds and found a linear model that best fit his data: y = 18.46+0.16%. To analyze the fit of his function, he found the residuals and created the following
residual plot.

Answers: 2


Other questions on the subject: Mathematics
Mathematics, 21.06.2019 22:30, qveensentha59
Which of the functions below could have created this graph?
Answers: 1
You know the right answer?
Leonard is studying the relationship between the fuel efficiency in miles per gallon (mp3), y, and t...
Questions in other subjects:


Physics, 25.05.2021 15:50
Mathematics, 25.05.2021 15:50
Mathematics, 25.05.2021 15:50

Mathematics, 25.05.2021 15:50


