24. SHORT ANSWER The line graph shows
the performance of a stock over a 5-day
period. Desc...

Mathematics, 19.05.2020 02:58 tiwaribianca475
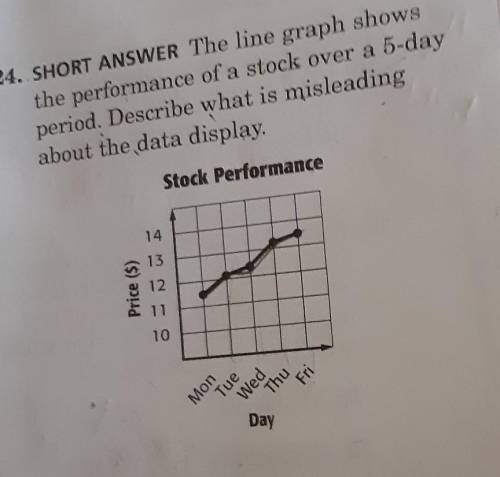
24. SHORT ANSWER The line graph shows
the performance of a stock over a 5-day
period. Describe what is misleading
about the data display,
Stock Performance

Answers: 1


Other questions on the subject: Mathematics
Mathematics, 21.06.2019 18:00, babydolltia28
Is a positive integer raised to a negative power always positive
Answers: 1
Mathematics, 21.06.2019 21:00, kharmaculpepper
Joanie watched 1 out of three of a movie in the morning
Answers: 1
You know the right answer?
Questions in other subjects:
Mathematics, 13.11.2020 22:00

English, 13.11.2020 22:00
Mathematics, 13.11.2020 22:00
Mathematics, 13.11.2020 22:00

Social Studies, 13.11.2020 22:00
Social Studies, 13.11.2020 22:00
Mathematics, 13.11.2020 22:00
English, 13.11.2020 22:00

Chemistry, 13.11.2020 22:00


