For which of the following sample sizes (n) and sample proportions (6) can a
normal curve be u...

Mathematics, 19.05.2020 02:21 Whitehouse9
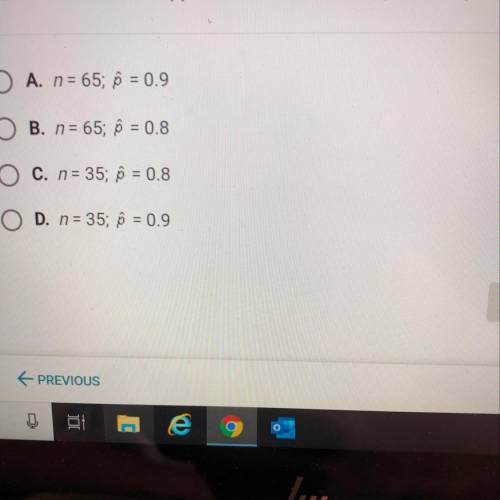
For which of the following sample sizes (n) and sample proportions (6) can a
normal curve be used to approximate the binomial probability histogram?

Answers: 3


Other questions on the subject: Mathematics
Mathematics, 21.06.2019 16:30, melissapulido198
Ineed if you could explain and give me the answer you! this needs done
Answers: 1
Mathematics, 21.06.2019 23:00, shmueller1554
How many heads would you expect if you flipped a coin twice? first, fill in the table below with the correct probabilities. hint: the sample space for flipping a coin twice is {hh, ht, th, tt}. a = b = c =
Answers: 3
Mathematics, 22.06.2019 05:30, amygutierrez34
The table represents a function. what is the value of f(-1)? f(x) o f(-1) = -3 -5 of(-1) = -1 of(-1) = 0 of(-1) = 6 - 3 whats the answer
Answers: 2
You know the right answer?
Questions in other subjects:
Mathematics, 05.06.2021 05:00
Mathematics, 05.06.2021 05:00
Mathematics, 05.06.2021 05:00

English, 05.06.2021 05:00
Mathematics, 05.06.2021 05:00
Mathematics, 05.06.2021 05:00
Mathematics, 05.06.2021 05:00
Mathematics, 05.06.2021 05:00


