
Mathematics, 17.05.2020 15:57 foziasif9525
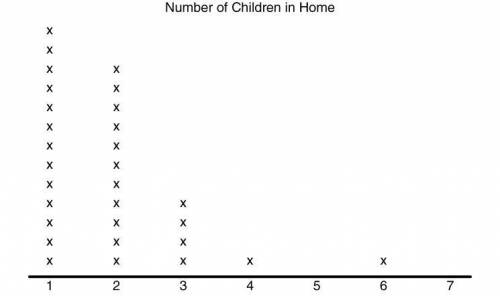
The following dot plot represents a random sample of elementary students and the number of children that live in their home.
Part 1: What is the range of the data set?
Part 2: What is the interquartile range of the data set?
Part 3: What is the mean absolute deviation of the data set? [Round both the mean and the mean absolute deviation to the nearest tenth.]

Answers: 3


Other questions on the subject: Mathematics
Mathematics, 21.06.2019 13:00, onegirl435
Find the value of the variable and the length of each secant segment.
Answers: 2
Mathematics, 21.06.2019 15:50, aidanfbussiness
If the dimensions of a rectangular prism are 5 ft x 3.5 ft x 2 ſt, what is the surface area?
Answers: 1
Mathematics, 21.06.2019 17:30, wwesuplexcity28
33% of college students say they use credit cards because of the rewards program. you randomly select 10 college students and ask each to name the reason he or she uses credit cards. find the probability that the number of college students who say they use credit cards because of the rewards program is (a) exactly two, (b) more than two, and (c) between two and five inclusive. if convenient, use technology to find the probabilities.
Answers: 1
You know the right answer?
The following dot plot represents a random sample of elementary students and the number of children...
Questions in other subjects:

English, 16.07.2021 14:20

Physics, 16.07.2021 14:20


