
Mathematics, 11.05.2020 18:57 iwantcandy2002
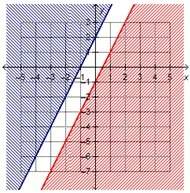
The students in Sam's school voted for their favorite subject. Sam displayed the results in the cinice graph shown
Which statements are true about the data in the graph? Check all that apply.
Favorite Subject
Other
8%
Math
2496
Language
Arts
Social Studies
16%
20%
Science
18%
Mark this and retum
Save and Exit
Sabt

Answers: 1


Other questions on the subject: Mathematics
Mathematics, 21.06.2019 21:40, salinasroel22
In a survey of 1015 adults, a polling agency asked, "when you retire, do you think you will have enough money to live comfortably or not. of the 1015 surveyed, 534 stated that they were worried about having enough money to live comfortably in retirement. construct a 90% confidence interval for the proportion of adults who are worried about having enough money to live comfortably in retirement.
Answers: 3
Mathematics, 21.06.2019 23:00, look26goingjbgy
Complete the conditional statement. if a + 2 < b + 3, then a < b b < a a – b < 1 a < b + 1
Answers: 3
Mathematics, 22.06.2019 01:40, savthespice
Manuela solved the equation below. what is the solution to manuela’s equation?
Answers: 2
You know the right answer?
The students in Sam's school voted for their favorite subject. Sam displayed the results in the cini...
Questions in other subjects:
Mathematics, 09.08.2021 20:40

Social Studies, 09.08.2021 20:40


