 = 1 decade
 decades
2.3 THINK: Florida Part 2
77
In 1840, the population of Florida was about 54,500. Betwee...

Mathematics, 07.05.2020 07:05 Zykuko
2.3 THINK: Florida Part 2
77
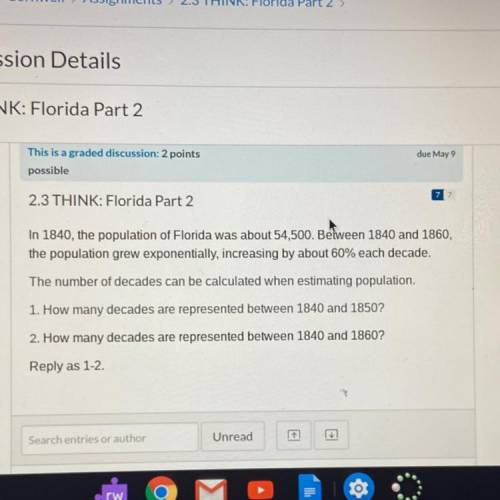
In 1840, the population of Florida was about 54,500. Between 1840 and 1860,
the population grew exponentially, increasing by about 60% each decade.
The number of decades can be calculated when estimating population.
1. How many decades are represented between 1840 and 1850?
2. How many decades are represented between 1840 and 1860?
Reply as 1-2

Answers: 1


Other questions on the subject: Mathematics
Mathematics, 21.06.2019 16:30, jayjay5246
Translate this phrase into an algebraic expression. 21 more than twice goran's savings use the variable g to represent goran's savings. need to know fast.
Answers: 1
Mathematics, 21.06.2019 18:30, BreBreDoeCCx
Solve the system of equations y= 3/2 - 1, -x+ y =-3
Answers: 1
Mathematics, 21.06.2019 22:30, muziqbox594
What is the name of a polygon that has four congruent sides and theses angle measures 60,120,60,120?
Answers: 1
You know the right answer?
Questions in other subjects:


