plot below.

Mathematics, 07.05.2020 06:00 isaiahjohnson2594
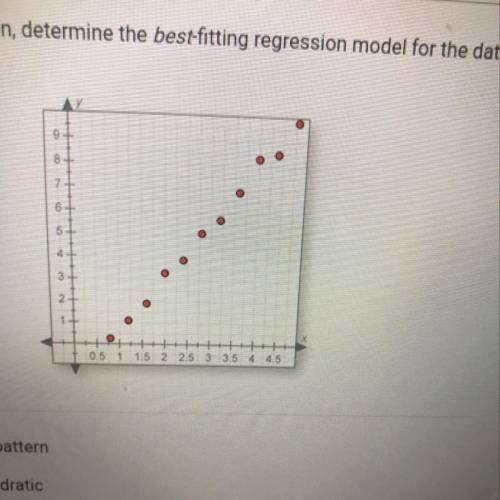
By visual inspection, determine the best-fitting regression model for the data
plot below.
+
0.5
1
1.5
2
2.5
3
3.5
4
4.5

Answers: 3


Other questions on the subject: Mathematics
Mathematics, 21.06.2019 22:00, dest8860
Which sum or difference identity would you use to verify that cos (180° - q) = -cos q? a.) sin (a -b) = sin a cos b – cos a sin b b.) cos (a -b) = cos a cos b – sin a sin b c.) cos (a -b) = cos a cosb + sin a sin b d.) sin (a + b) = sin a cos b + cos a sin b
Answers: 1
Mathematics, 21.06.2019 22:30, DatBoiCedd
Convert (-3,0) to polar form. a. (3,0’) b. (-3,180’) c. (3,180’) d. (3,360’)
Answers: 1
Mathematics, 22.06.2019 04:00, lollipop83
Which equation represents the function on the graph?
Answers: 2
Mathematics, 22.06.2019 06:00, cruzsuarezjanca
For problems 7–10, state a reasonable domain for the problem statement, find the inverse function f –1(x), and identify the independent and dependent quantities of the inverse. 7. gary is jogging. the total distance he has traveled, in miles, can be estimated using the function f(x) = 9x, where x is his jogging time in hours. 8. camryn sells computers. she earns commission for her computer sales plus a fixed wage for each day she works. her daily earnings, in dollars, can be estimated using the function f(x) = 0.15x + 50, where x represents her computer sales in dollars. 9. the distance a motorboat travels, in meters, can be estimated using the equation f(x) = 1.9x2, wherexisthetimeinseconds, for0≤x≤10. 10. a rock band is selling tickets to a concert at a theater. the band earns money for each ticket sold, but has to pay some of the earnings to the theater. the total money earned by the band can be estimated using the function f(x) = 7.5x – 300, where x is the number of tickets sold.
Answers: 1
You know the right answer?
By visual inspection, determine the best-fitting regression model for the data
plot below.
plot below.
Questions in other subjects:

History, 23.09.2019 15:10
History, 23.09.2019 15:10

Biology, 23.09.2019 15:10


Chemistry, 23.09.2019 15:10


