.
hi
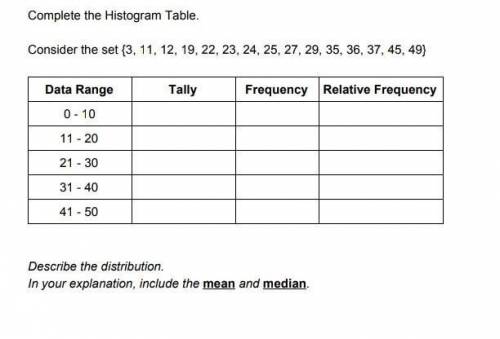
Complete the Histogram Table.
HHH
DU
Consider the set {3, 11, 12, 19,...

Mathematics, 07.05.2020 04:09 aidenbender06
.
hi
Complete the Histogram Table.
HHH
DU
Consider the set {3, 11, 12, 19, 22, 23, 24, 25, 27, 29, 35, 36, 37, 45, 49}
e
SEST
Data Range
FM
Tally
Frequency
Relative
Frequency
TGT
0 - 10
11 - 20
21 - 30
31 - 40
LLL
w
1
1
1
.
INCIN
41 - 50
TA
Describe the distribution.
In your explanation, include the mean and median.
nean
edia

Answers: 3


Other questions on the subject: Mathematics
Mathematics, 21.06.2019 18:30, kellypechacekoyc1b3
Suppose your school costs for this term were $4900 and financial aid covered 3/4 of that amount. how much did financial aid cover? and how much do you still have to pay?
Answers: 1
Mathematics, 21.06.2019 23:30, reycaden
The number of members f(x) in a local swimming club increased by 30% every year over a period of x years. the function below shows the relationship between f(x) and x: f(x) = 10(1.3)xwhich of the following graphs best represents the function? graph of f of x equals 1.3 multiplied by 10 to the power of x graph of exponential function going up from left to right in quadrant 1 through the point 0, 0 and continuing towards infinity graph of f of x equals 10 multiplied by 1.3 to the power of x graph of f of x equals 1.3 to the power of x
Answers: 1
You know the right answer?
Questions in other subjects:

Engineering, 04.01.2022 17:40


Mathematics, 04.01.2022 17:50


