
Mathematics, 07.05.2020 04:07 owoeli
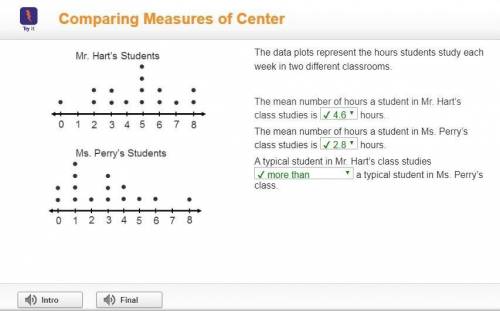
The data plots represent the hours students study each week in two different classrooms. The mean number of hours a student in Mr. Hart’s class studies is hours. The mean number of hours a student in Ms. Perry’s class studies is hours. A typical student in Mr. Hart’s class studies a typical student in Ms. Perry’s class.

Answers: 3


Other questions on the subject: Mathematics
Mathematics, 22.06.2019 02:50, salazarx062
There are 85 apples on the big tree, john picked out 15%. how many did john pick out?
Answers: 2
You know the right answer?
The data plots represent the hours students study each week in two different classrooms. The mean nu...
Questions in other subjects:
Mathematics, 06.11.2020 22:30


Social Studies, 06.11.2020 22:30

History, 06.11.2020 22:30
Mathematics, 06.11.2020 22:30
Mathematics, 06.11.2020 22:30


