
Mathematics, 07.05.2020 01:03 Galaxie85111
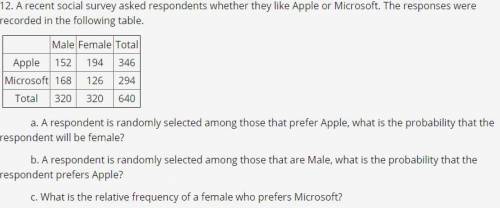
A recent social survey asked respondents whether they like Apple or Microsoft. The responses were recorded in the following table.
(see pic)
a. A respondent is randomly selected among those that prefer Apple, what is the probability that the respondent will be female?
b. A respondent is randomly selected among those that are Male, what is the probability that the respondent prefers Apple?
c. What is the relative frequency of a female who prefers Microsoft?
WILL GIVE 15 POINTS AND MY GRATITUDE :)

Answers: 1


Other questions on the subject: Mathematics
Mathematics, 21.06.2019 12:50, samariamartinez1029
Tori examined the pattern of exponents in the table. based on the pattern, which statements are true? check all that apply.
Answers: 2
Mathematics, 21.06.2019 18:50, khalfani0268
The number of fish in a lake can be modeled by the exponential regression equation y=14.08 x 2.08^x where x represents the year
Answers: 3
Mathematics, 21.06.2019 21:40, oprajapati
The management of a supermarket wants to adopt a new promotional policy of giving a free gift to every customer who spends more than a certain amount per visit at this supermarket. the expectation of the management is that after this promotional policy is advertised, the expenditures for all customers at this supermarket will be normally distributed with a mean of $95 and a standard deviation of $20. if the management wants to give free gifts to at most 10% of the customers, what should the amount be above which a customer would receive a free gift?
Answers: 2
You know the right answer?
A recent social survey asked respondents whether they like Apple or Microsoft. The responses were re...
Questions in other subjects:


French, 20.03.2021 19:30


English, 20.03.2021 19:30

Mathematics, 20.03.2021 19:30

Social Studies, 20.03.2021 19:30


