70 points
A food truck did a daily survey of customers to find their food preferences. T...

Mathematics, 06.05.2020 18:02 marquion
70 points
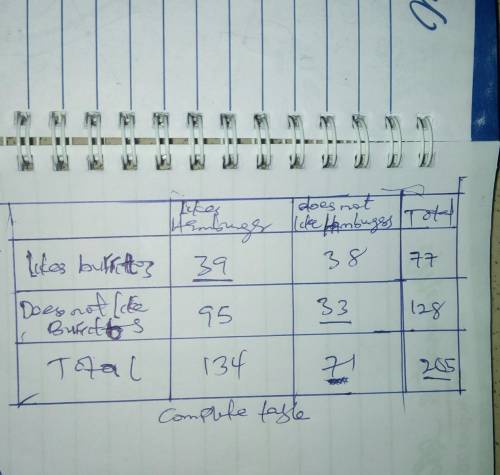
A food truck did a daily survey of customers to find their food preferences. The data is partially entered in the frequency table. Complete the table to analyze the data and answer the questions:
Likes hamburgers Does not like hamburgers Total
Likes burritos 38 77
Does not like burritos 95 128
Total 134 71
Part A: What percentage of the survey respondents did not like either hamburgers or burritos? (2 points)
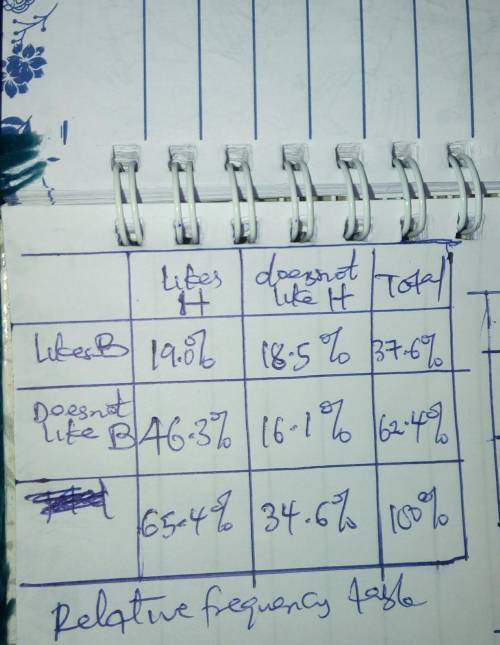
Part B: Create a relative frequency table and determine what percentage of students who like hamburgers also like burritos. (3 points)
Part C: Use the conditional relative frequencies to determine which data point has strongest association of its two factors. Use complete sentences to explain your answer. (5 points)

Answers: 2


Other questions on the subject: Mathematics
Mathematics, 21.06.2019 17:00, alannismichelle9
The following graph shows the consumer price index (cpi) for a fictional country from 1970 to 1980? a.) 1976 - 1978b.) 1972 - 1974c.) 1974 - 1976d.) 1978 - 1980
Answers: 1
You know the right answer?
Questions in other subjects:

English, 21.04.2020 04:44
Mathematics, 21.04.2020 04:44

Advanced Placement (AP), 21.04.2020 04:44
Mathematics, 21.04.2020 04:44
Mathematics, 21.04.2020 04:44
Mathematics, 21.04.2020 04:44


