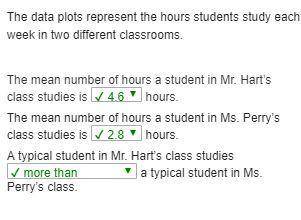
The data plots represent the hours students study each week in two different classrooms.
...

Mathematics, 05.05.2020 22:43 mishcacross21
The data plots represent the hours students study each week in two different classrooms.
The mean number of hours a student in Mr. Hart’s class studies is hours.
The mean number of hours a student in Ms. Perry’s class studies is hours.
A typical student in Mr. Hart’s class studies a typical student in Ms. Perry’s class.
Poop

Answers: 2


Other questions on the subject: Mathematics
Mathematics, 21.06.2019 15:00, Shavaila18
The data shown in the table below represents the weight, in pounds, of a little girl, recorded each year on her birthday. age (in years) weight (in pounds) 2 32 6 47 7 51 4 40 5 43 3 38 8 60 1 23 part a: create a scatter plot to represent the data shown above. sketch the line of best fit. label at least three specific points on the graph that the line passes through. also include the correct labels on the x-axis and y-axis. part b: algebraically write the equation of the best fit line in slope-intercept form. include all of your calculations in your final answer. part c: use the equation for the line of best fit to approximate the weight of the little girl at an age of 14 years old.
Answers: 3
Mathematics, 21.06.2019 17:00, thicklooney
Which expression is equivalent to 8(k + m) − 15(2k + 5m)?
Answers: 1
Mathematics, 21.06.2019 19:30, Animallover100
Write the sine and cosine values of a, b, respectively, in the figure for (1) and (2) + explanation.
Answers: 1
You know the right answer?
Questions in other subjects:
Mathematics, 14.04.2021 23:20

Business, 14.04.2021 23:20


Mathematics, 14.04.2021 23:20


