
Mathematics, 05.05.2020 22:39 Prolearner1234
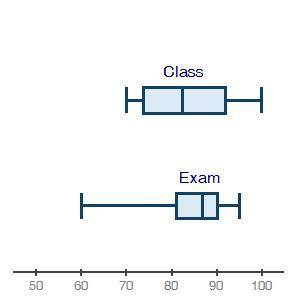
The box plots below show student grades on the most recent exam compared to overall grades in the class:
Which of the following best describes the information about the medians? (1 point)
Group of answer choices
The exam outlier at 60 makes the IQR narrower and the median higher.
The class data is more evenly spread, which pulls its median down.
The class median is lower than the exam median.
The class Q3 is higher than the exam Q3.

Answers: 1


Other questions on the subject: Mathematics
Mathematics, 21.06.2019 21:30, gigglegirl5802
Select all the statements that apply to this figure
Answers: 2
Mathematics, 21.06.2019 23:20, jessicasbss6840
Suppose a laboratory has a 30 g sample of polonium-210. the half-life of polonium-210 is about 138 days how many half-lives of polonium-210 occur in 1104 days? how much polonium is in the sample 1104 days later? 9; 0.06 g 8; 0.12 g 8; 2,070 g
Answers: 1
Mathematics, 21.06.2019 23:30, fonzocoronado3478
Answer each of the questions for the following diagram: 1. what type of angles are these? 2. solve for x. what does x equal? 3. what is the measure of the angles?
Answers: 1
You know the right answer?
The box plots below show student grades on the most recent exam compared to overall grades in the cl...
Questions in other subjects:
Mathematics, 24.02.2021 01:50
Mathematics, 24.02.2021 01:50

Mathematics, 24.02.2021 01:50
Mathematics, 24.02.2021 01:50
Mathematics, 24.02.2021 01:50
Mathematics, 24.02.2021 01:50


Biology, 24.02.2021 01:50


