Mathematics, 05.05.2020 19:38 adamkinney9345
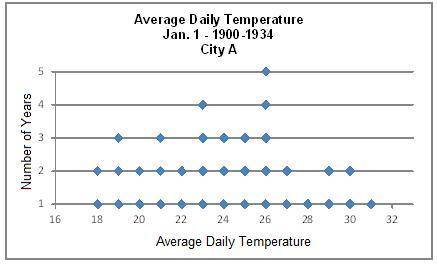
The graph below shows the average daily temperatures on January 1 from 1900 to 1934 for city A.
The mean of the temperatures in the chart is 24° with a standard deviation of 4°. Which temperature is within one standard deviation of the mean?
18°
19°
22°
30°


Answers: 1


Other questions on the subject: Mathematics

Mathematics, 21.06.2019 18:20, Gigglygoose4181
Choose all that apply. select all of the fees a credit card may have. annual fee apr balance transfer fee cash advance fee late fee overdraft fee over-the-limit fee
Answers: 2

Mathematics, 21.06.2019 18:40, ferny5106
Dexter read 11 science fiction books and 5 history books. lena read 9 science fiction books and 4 history books. compare the students’ ratios of science fiction books to history books. 1. determine the ratios’ form: science fiction books to history books 2. write the ratios as fractions: dexter: 115; lena: 94 3. rewrite with a common denominator. 4. compare. 5. answer the question. determine which shows the correct comparison of the ratios for this problem.
Answers: 1

Mathematics, 21.06.2019 19:30, SMURFETTE86
Identify the number 127 as a rational or irrational. explain
Answers: 2

Mathematics, 21.06.2019 21:50, gamergladiator43
Tamar is measuring the sides and angles of tuv to determine whether it is congruent to the triangle below. which pair of measurements would eliminate the possibility that the triangles are congruent
Answers: 1
You know the right answer?
The graph below shows the average daily temperatures on January 1 from 1900 to 1934 for city A.
Questions in other subjects:

Mathematics, 18.07.2019 13:00

Computers and Technology, 18.07.2019 13:00

Biology, 18.07.2019 13:00

Mathematics, 18.07.2019 13:00


Social Studies, 18.07.2019 13:00


