These tables represent a quadratic function with a vertex at (0, -1). What is
the average rate...

Mathematics, 05.05.2020 10:52 jksimmons2364
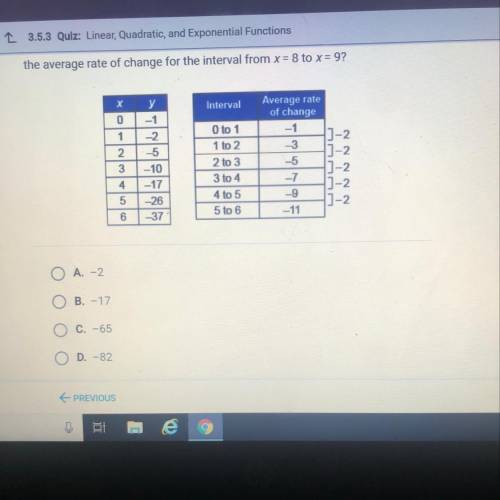
These tables represent a quadratic function with a vertex at (0, -1). What is
the average rate of change for the interval from x = 8 to x = 9?
X
y
Interval
O
Average rate
of change
-1
-1
-2
-5
1
]-2
3
7-2
E
NNN
3
O to 1
1 to 2
2 to 3
3 to 4
4 to 5
5 to 6
4
-10
-17
-26
-37
_
5
-7
-9
-11
5
6

Answers: 1


Other questions on the subject: Mathematics
Mathematics, 21.06.2019 16:00, ctyrector
The classrooms are trying to raise $1,200.00 for charity. mrs. leblanc's class has raised 50%. mr. patel's class has raised $235.14 ms. warner's class has raised 1/3 as much as mrs. leblanc's class. how much more money is needed to reach the goal of $1,200.00?
Answers: 1
Mathematics, 21.06.2019 17:00, emmaline11
Acertain population of bacteria demonstrates exponential growth doubles in size every 4 days. how long will it take the population to triple in size?
Answers: 1
You know the right answer?
Questions in other subjects:


