Consider the plot that was created from the residuals of a line of best fit for a set of data.
...

Mathematics, 05.05.2020 08:53 heids17043
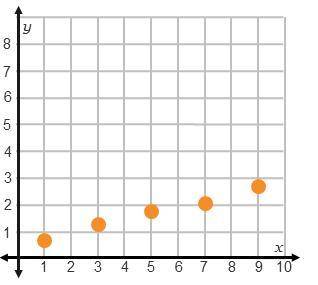
Consider the plot that was created from the residuals of a line of best fit for a set of data.
Does the residual plot show that the line of best fit is appropriate for the data?
A)Yes, the points are rising.
B)Yes, the points are all above the x-axis.
C)No, it follows a pattern.
D)No, the points are falling.
30 points

Answers: 2


Other questions on the subject: Mathematics
Mathematics, 21.06.2019 15:30, jermainedwards
Divide: 1573 ÷ 7 = a) 222 r5 b) 223 r6 c) 224 r5 d) 224 r3
Answers: 2
Mathematics, 21.06.2019 21:00, venancialee8805
The perimeter of a rectangle is 42 inches. if the width of the rectangle is 6 inches, what is the length
Answers: 2
Mathematics, 21.06.2019 21:30, mazolethrin6876
The expression 1.01*1.005(^t) gives the amount of money, in thousands of dollars, in carter's savings account (t) years after he opens it. what does 1.01 represent in this expression?
Answers: 1
Mathematics, 21.06.2019 22:00, jacksonshalika
Billie holiday sells children's clothing for sara vaughn's toddler shop. baby blankets sell for $29.99 after a markup rate based on cost of 109%. find the cost and the markup.
Answers: 2
You know the right answer?
Questions in other subjects:


Biology, 28.11.2019 15:31

Mathematics, 28.11.2019 15:31
Mathematics, 28.11.2019 15:31


