Plz help ASAP thanks
Does this graph show a proportional relationship between the pound...

Mathematics, 05.05.2020 06:56 TaraC
Plz help ASAP thanks
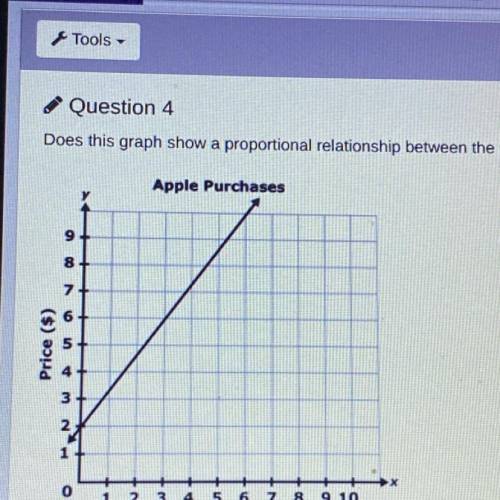
Does this graph show a proportional relationship between the pounds of apples bought and the price?
Yes because the line on the graph is straight.
Yes because the line moves through the y-axis
No because the line does not pass through the origin
No because the line does not give a y-value for every x-Value

Answers: 1


Other questions on the subject: Mathematics
Mathematics, 21.06.2019 19:30, cykopath
Me max recorded the heights of 500 male humans. he found that the heights were normally distributed around a mean of 177 centimeters. which statements about max’s data must be true? a) the median of max’s data is 250 b) more than half of the data points max recorded were 177 centimeters. c) a data point chosen at random is as likely to be above the mean as it is to be below the mean. d) every height within three standard deviations of the mean is equally likely to be chosen if a data point is selected at random.
Answers: 2
Mathematics, 21.06.2019 23:00, BaileyElizabethRay
Find the distance between c and d on the number line c=3 and d=11
Answers: 1
You know the right answer?
Questions in other subjects:


English, 27.04.2021 15:00


