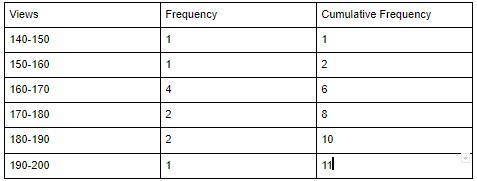
158, 164, 146, 170, 165, 187, 164, 174, 186, 197
a. Create a frequency table to represent the...

Mathematics, 05.05.2020 03:54 kayladvine
158, 164, 146, 170, 165, 187, 164, 174, 186, 197
a. Create a frequency table to represent the data (2 points):
Number of Views:
Frequency:
b. Create a histogram to represent the data
c. Find the mean, median, mode, and range of the data. Round to the nearest tenth if
necessary
d. Find the minimum, first quartile, third quartile, and a maximum of the data. Round to the nearest tenth if necessary
e. Create a box-and-whisker plot to represent the data
f. Find the 40th percentile for the data set

Answers: 2


Other questions on the subject: Mathematics
Mathematics, 21.06.2019 20:30, stgitskaysie9028
Write an expression that represent sarah’s total pay last week. represent her hourly wage with w monday 5 tuesday 3 wednesday 0 noah hours wednesday 8 only with w wage did noah and sarah earn the same amount last week?
Answers: 3
Mathematics, 21.06.2019 21:00, izaiahfieods
Bella want to know what the students at her school think of her show. which is the best group to survey to find this information a. go to the mall and ask all of the students she recognizes from school b. ask her viewers to call in durning an episode of the show c. get a list of students at her school from the office and use a random number generator to pick 30 of them d. get a list of students at her school from the office and pick the first 30 students on the list
Answers: 1
Mathematics, 21.06.2019 21:30, kassandramarie16
Noel is hoping to make a profit (in $) on the school play and has determined the function describing the profit to be f(t) = 8t – 2654, where t is the number of tickets sold. what does the number 8 tell you?
Answers: 1
You know the right answer?
Questions in other subjects:
Mathematics, 01.07.2019 01:30
Mathematics, 01.07.2019 01:30

History, 01.07.2019 01:30

Spanish, 01.07.2019 01:30
Mathematics, 01.07.2019 01:30
Mathematics, 01.07.2019 01:30


