
Mathematics, 04.05.2020 22:53 Shu11
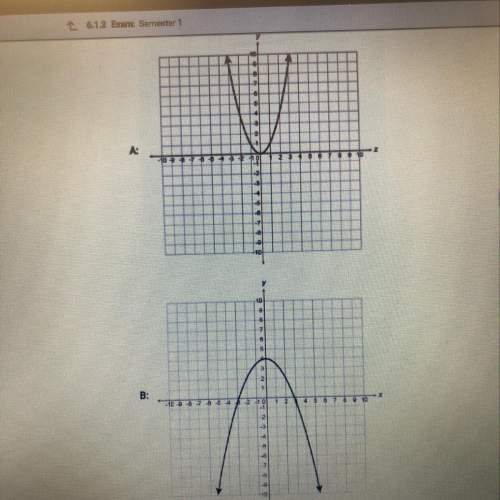
The graph below shows the experimental probability of a runner finishing in first place (1), in second place (2), in third place (3), or
not placing (4). Which of the following describes the probability distribution?
Finishing Place
PXIX)
constant
symmetric
negatively skewed
nositively skewed
Mark this and return
Save and Exit
Next
Submit

Answers: 1


Other questions on the subject: Mathematics
Mathematics, 21.06.2019 23:30, weirdojuwin
In an isosceles triangle, the vertex angle is 112 degrees. what is the measure of each base. a.34 b.24 c.44 d.54
Answers: 1
Mathematics, 22.06.2019 00:50, jasmine77723
How does the graph of y = 3x compare to the graph of y = 3-x?
Answers: 1
You know the right answer?
The graph below shows the experimental probability of a runner finishing in first place (1), in seco...
Questions in other subjects:
Mathematics, 24.09.2019 01:10

Chemistry, 24.09.2019 01:10
Mathematics, 24.09.2019 01:10

Mathematics, 24.09.2019 01:10

English, 24.09.2019 01:10


